
Analyzing Customers Using the Cohort Report
Last updated on Sep 19, 2026
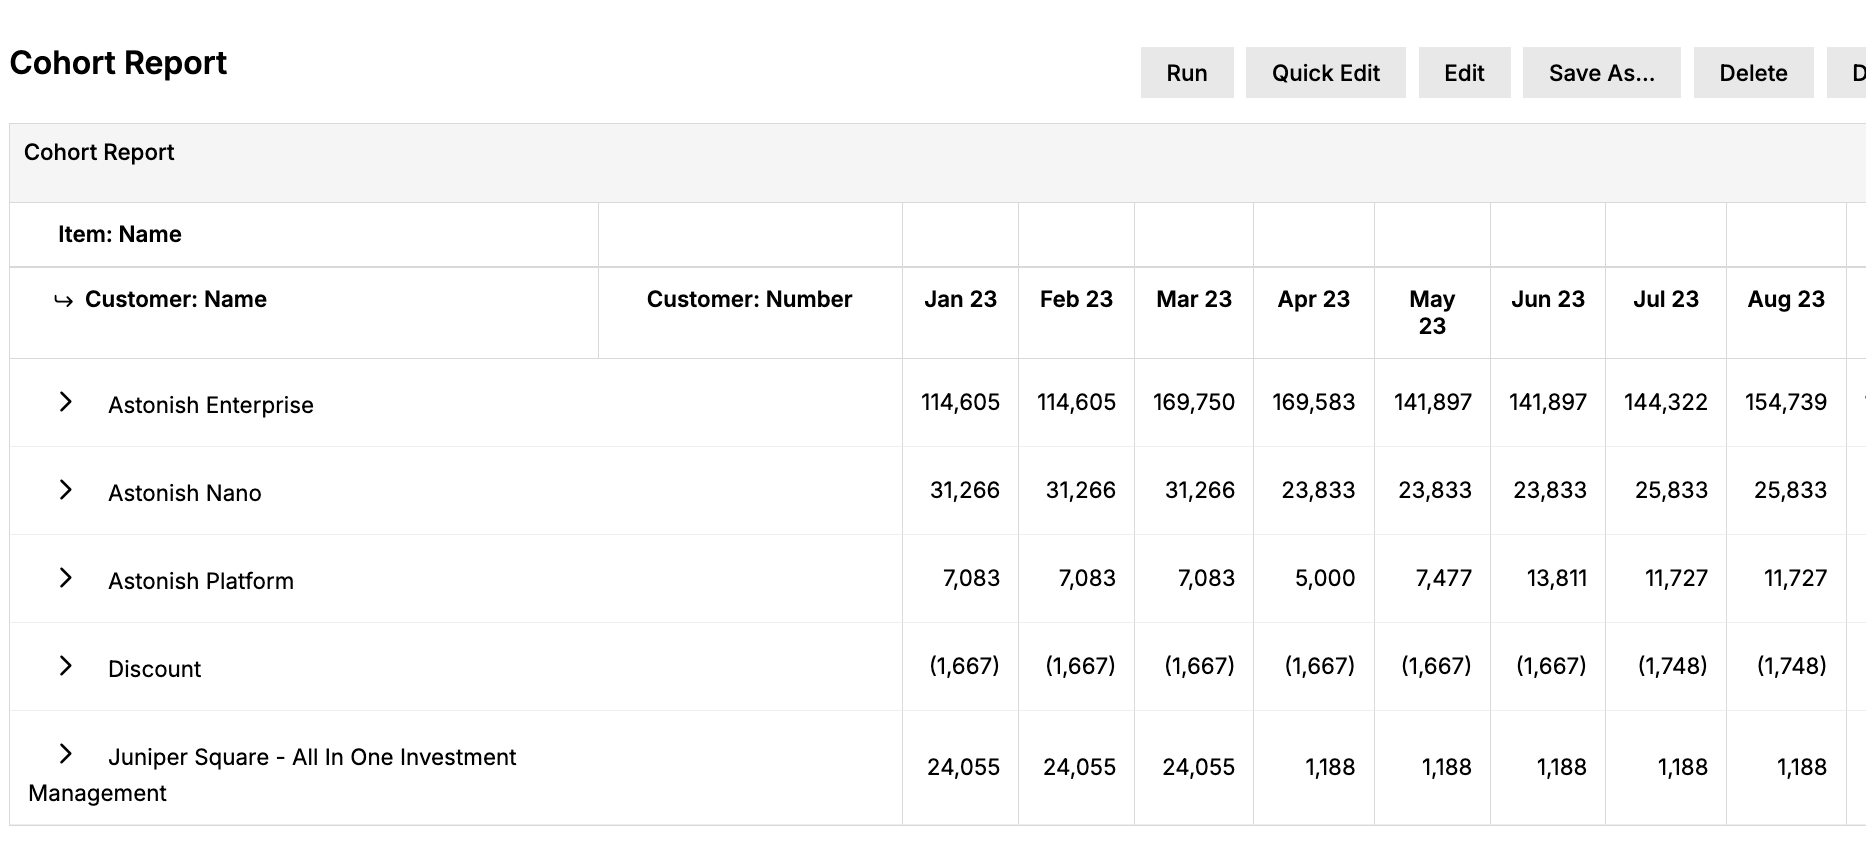
A cohort is a "like group" of Customers. The Cohort Report lets you analyze these like groups. In a subscription business, the most common cohort is the "class of," meaning the Customers who started in a specific month. A cohort could also be all Customers in a specific industry, sold through a specific channel, or sold by a specific sales rep. You can report by a number of different cohorts using the Cohort Report.
Configuration options
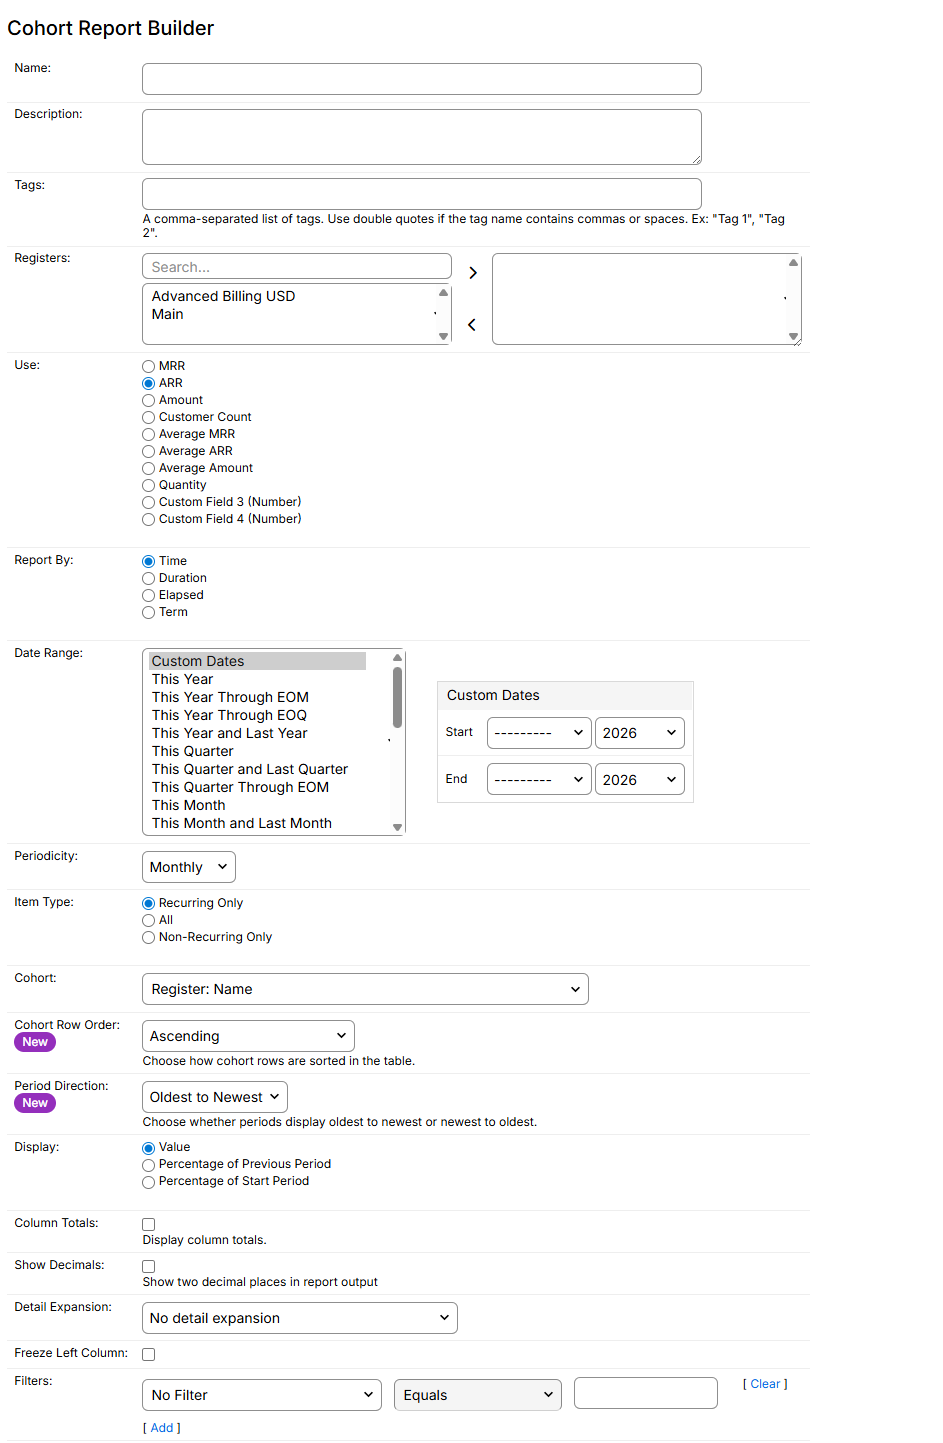
To open the Cohort Report Builder, go to Reports > Add Report > Analytics Reports, then select Cohort. Configure the following settings before you run the report.
| Setting | Description |
|---|---|
| Currency Presentation | Choose to report in either the designated Home Currency of your entity, or the Local Currency of the Register you're reporting in. You can report across Registers if you select Home Currency. If you select Local Currency, you must select at least one Register, and all selected Registers must use the same currency. |
| Registers | Select one or more Registers from which Transactions are included. If you don't select a Register, all Registers are included. |
| Use | Select MRR, ARR, Amount, Customer Count, Quantity, Average MRR, Average ARR, or Average Amount. If your account has numeric custom fields defined on Transactions, those also appear as additional choices (shown as Custom Field 3 (Number) and Custom Field 4 (Number) in the example above). For purely monthly subscription businesses, MRR and Amount may be the same. However, if you have prorated Transactions, choose MRR. |
| Report By | Report By determines the class of columns displayed. If you report by Time, the columns are dates. If you report by Term, the columns are whole Term Numbers.
|
| Date Range | Choose the date range you want to report on, or create a custom date range. |
| Periodicity | Columns appear for each of the following periods within the Date Range specified above.
|
| Start & End | Select the number of periods you want to count. This displays only if you're using the Duration, Elapsed, or Term options for the Report By setting. |
| Item Group | Select an optional Item Group as a mechanism to filter Transactions. This report can include both recurring and non-recurring Transactions, depending on which Items the Item Group contains. If you don't select an Item Group, all Transactions are included. If you select an Item Group with no Items, all Transactions are also included. See Create and Use Item Groups for how to create or manage these. |
| Item Type | The Item Type selection limits which Transactions are included in the analysis.
|
| Cohort | Cohort determines how rows are grouped in the report. For the most common type of cohort reporting, select one of the "Earliest" options below. The Earliest date is determined before any filters are applied.
|
| Cohort Row Order | Choose how cohort rows are sorted in the table. This option gives finance teams, analysts, and product managers more flexibility when reviewing MRR cohort performance. Options:
|
| Period Direction | Choose whether periods display oldest to newest or newest to oldest across the report. This option controls the visual direction of time, making it easier to focus on recent or historical performance. Options:
|
| Display | Select whether to display actual numbers or percentage changes. When you select one of the "Percentage" options, the first column displays the absolute value, and all columns to the right display the percentage change.
|
| Colors | Color-coding for your report is available only if you select one of the percentage options (Percentage of Previous Period or Percentage of Start Period) for Display. Assign colors to percentage thresholds to make your report results easier to interpret. The color for each threshold applies to result values at or above the entered threshold, and the color assigned for the bottom row (the default threshold) applies to all result values below the lowest threshold. Use these color thresholds to help you identify MRR retention, expansion, and contraction across multiple reporting periods. |
| Column Totals | Check this box to display a totals row with the sum of each column's values. |
| Show Decimals | Check this box to show two decimal places in the report output. |
| Detail Expansion | Similar to other Reports within Maxio Platform, expand based on Customer or Momentum Category for further segmenting.
|
| Freeze Left Column | Check this box to lock the immediate left column in place, allowing you to scroll through the rest of the report while keeping this left column visible. |
| Filters | Select one or more filters and appropriate matching criteria to filter Transactions in or out. See Build Precise Searches Using List Filters for details. |
Drill down to individual transactions
Selecting Transaction: Number as your Cohort creates a specialized cohort with its own properties and functionality. A Cohort Report using this cohort works the same as the Transaction Momentum Report you get when you drill down to the most granular level of the Advanced Subscription Momentum Report Overview. Whether you create it through that drill-down or directly in the Cohort Report builder, this cohort bridges the gap between the higher-level Subscription Momentum™ calculations and the more detailed Cohort calculations.
When you create a Cohort Report using Transaction: Number as your Cohort, you can add additional Customer, Item, or Transaction details to the report to control how granular the results are.
Report results
Each row in the report represents a unique cohort. Transactions are included in the calculation only if they have an Item that's part of the selected Item Group.
Important: For a report column, a Transaction is included only if it has both a Start Date on or before the last day of the month, and an End Date on or after the last day of the month.
The following examples show how a Transaction's Start Date and End Date determine which periods it's included in, based on your Report By selection.
Transaction date examples by Report By selection
| Transaction dates | By Time | By Duration (Monthly) | By Elapsed (Monthly) |
|---|---|---|---|
| Start 2/15, End 2/28 | Included in February only | Excluded from Month 1 | Included in Month 1 |
| Start 2/15, End 3/31 | Included in February and March | Included in Month 1 only | Included in Month 1 and Month 2 |
| Start 2/15, End 3/30 | Included in February only | Included in Month 1 only | Included in Month 1 only |
| Start 3/15, End 3/30 | Excluded | Excluded | Excluded |
Any Transaction with a non-recurring Item (one-time) whose Start Date equals its End Date, and that date isn't the last day of the month, is excluded, even if the Item is included in the Item Group.
Related information
For which cohort shape, percentage view, and Momentum expansion answer which retention question, see What You Can Do with the Cohort Report.
Still need help?
Reach out and our support team will take it from here.