
Fast Start with One-Click Reports
Last updated on Aug 25, 2026
One-Click Reports give you a fast, pre-configured starting point for ARR/MRR trends, Customer counts by period, renewals, and churn. Run a template in seconds, then click Save As... to customize filters and date ranges; export charts for presentations and toggle legend items to focus the view. Each One-Click Report starts with the question you're trying to answer and is pre-configured so you won't get stuck worrying about the right settings to include or exclude.
Using One-Click Reports
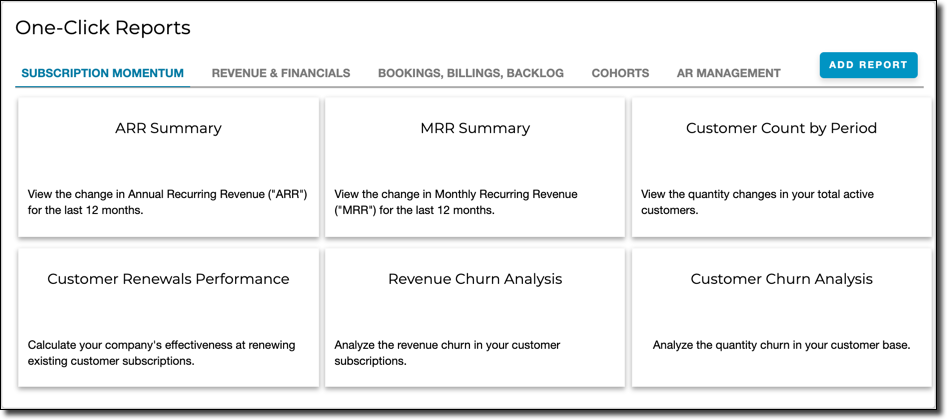
One-Click Reports live in their own area of Maxio Platform, organized into tabs by category.
To generate a One-Click Report
-
On the side navigation bar, expand Reports and select One-Click Reports.
-
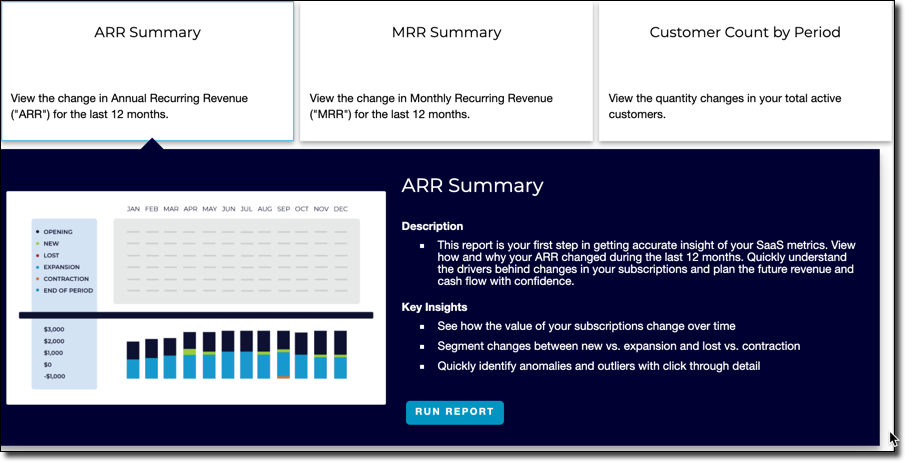
Select the One-Click Report you want to create using the tabs at the top of the screen. Each tab's reports include a graphical preview, a description, and the key insights you'll find inside.
-
Click the Run Report button.
Customizing a One-Click Report
One-Click Reports are designed to give you a good first step in analyzing your financial data. After generating a report, make any tweaks to its configuration to suit your specific needs.
To do this, run a One-Click Report, view its results, and then click Save As.... This opens the report's configuration screen, where you can make any needed changes, such as the date range or filters, and save it.
Using charts
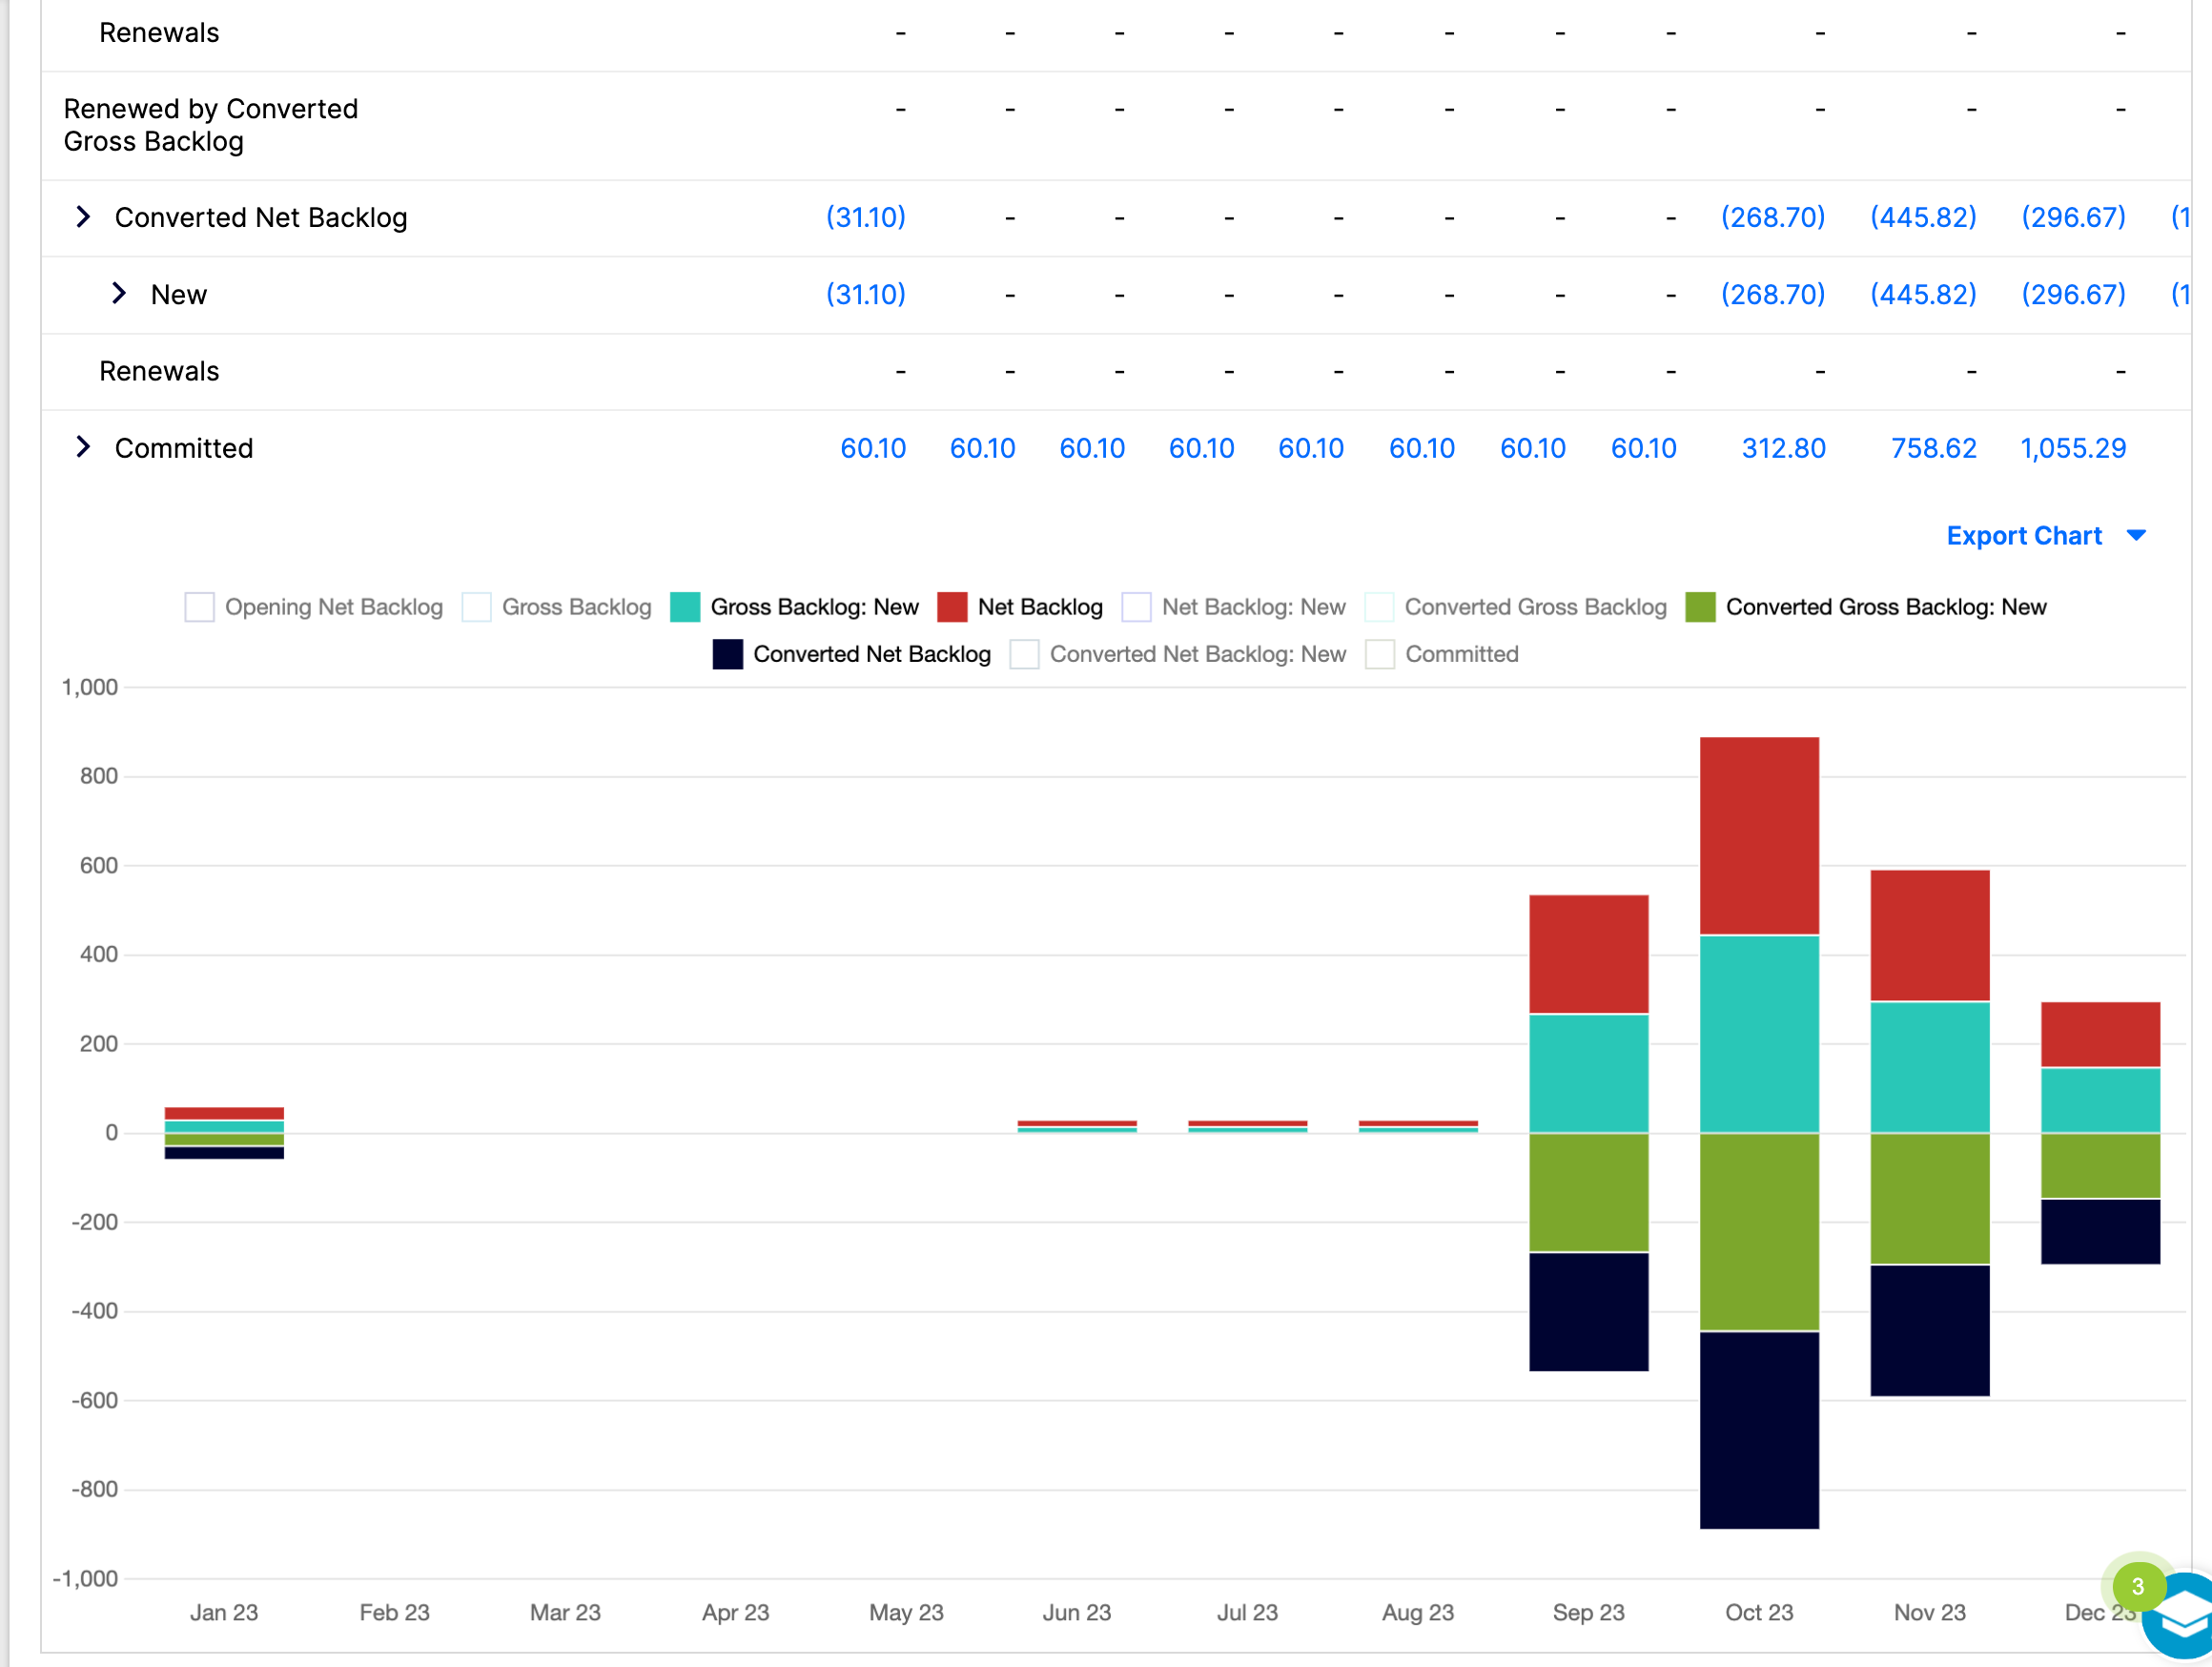
When you create a One-Click Report, a chart appears underneath the report's figures, corresponding directly to the report's data. Export the chart using the Export Chart link. To narrow the chart to specific categories, select the colored boxes above it to toggle those categories on or off.
Related information
For more on report charts generally, see Report charts.
For background on how ARR and MRR are calculated in Maxio, see Understanding ARR, MRR, and GRR in Maxio.
Still need help?
Reach out and our support team will take it from here.