
Create and Manage Reports
Last updated on Aug 26, 2026
Learn how to create, configure, run, and maintain Maxio Platform reports, including core configuration options like filters, date range, periodicity, and output formats, plus Quick Edit, charting, Report History and retention, large-report handling, bulk delete rules, and tags, so you can build reliable, reusable reporting.
Create a report
- On the side navigation bar, expand Reports and select Reports Home.
- Click Add Report.
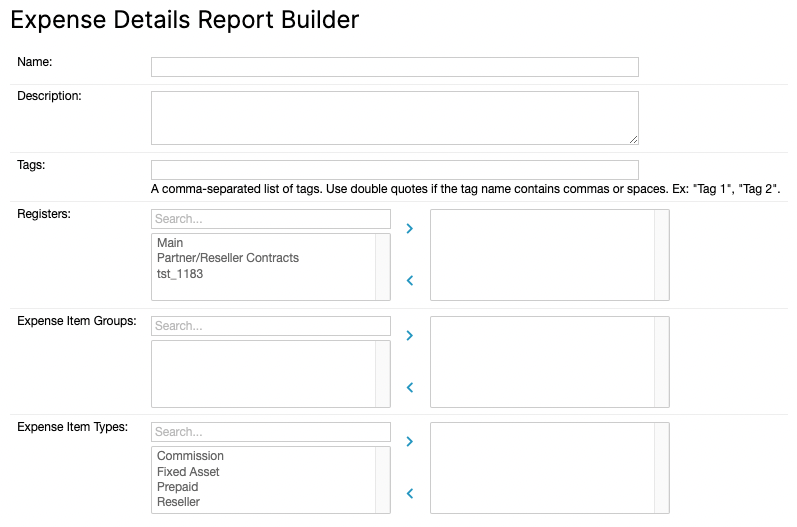
- Select a report type from Finance Reports, Analytics Reports, or Expenses Reports, then configure the report, including its name and description. For most reports, you also need to configure the report's rows and columns. Refer to the report-specific help articles for more information on each report's configuration options.
- View the report as you work on it, and save it when it's ready.
Common configuration options
The following configuration options are available for most reports.
| Configuration option | Definition |
|---|---|
| Name | The name of the report that appears on the main Reports page. |
| Description | A description of the report that appears on the main Reports page. |
| Currency Presentation | If you have multi-currency enabled, choose how amounts are presented: Home Currency, Local Currency, or, on some reports, FX Restated Reporting. |
| Registers | If you have only one Register, this control is hidden. If you have multiple Registers and don't select one, all Registers are included. |
| Filters | When you use multiple filters, you're always using the AND condition. You can't filter using an OR condition across multiple filters. Within a single filter, you can use the In and Not In operators as an Or condition. |
| Date Range | The span of time that the report covers. |
| Periodicity | The periods of time that the report summarizes the date range into. |
| Freeze Left Column/Header Row | Freezes the report's left-most column, top row, or both, so long reports stay easier to read. |
| Output Format | You can output the report's data into tables and various types of charts. |
Report filters
Be aware of the following when creating filters for reports.
Filters exist in Finance Reports to enable the creation of specialized report results.
WARNING: Filters can have unintended consequences on report results. Use extreme caution when applying filters to a report you're using for GAAP reporting.
| Filter type | Details |
|---|---|
| Wild cards | There is no wildcard character or function. |
| "In" and "Not In" operators | In creates an "either/or" filter; Not In creates a "neither/nor" filter. The In operator is case-sensitive and requires a semicolon (;) as a separator, with no extra spaces around it, since a space is treated as part of the value.
|
| True and False fields | For binary fields typically shown as a checkbox on Maxio Platform's edit screens (for example, Recognize, Do Not Sync, Permit Imbalance, and Canceled), the filter value must be exactly True or False, capitalized this way.
|
| Date Field | Must be in the format YYYY-MM-DD. For example, enter 2020-03-03 for March 3, 2020. |
| Transaction Duration | Requires special syntax. See Filter by Transaction Duration. |
Filter by Transaction Duration
Filtering on Transaction Duration uses the syntax timeunit=numberoftimeunits,days=-1. If the Transaction's start and end date are the same, use days=0 instead.
| Duration | Use this filter |
|---|---|
| End date same as start date | days=0 |
| One Month | months=1,days=-1 |
| Six Months | months=6,days=-1 |
| One Year | years=1,days=-1 |
| Two Years | years=2,days=-1 |
| Three Years | years=3,days=-1 |
| Five Years | years=5,days=-1 |
Run, view, and edit reports
The reports you create appear on the Reports page. Click a report's name to run it and view its up-to-date metrics. You can also click the Last Run Date (if available) to view the report's results from that specific day and time. After saving a report, you can download its results as a CSV file and view them in a spreadsheet program.
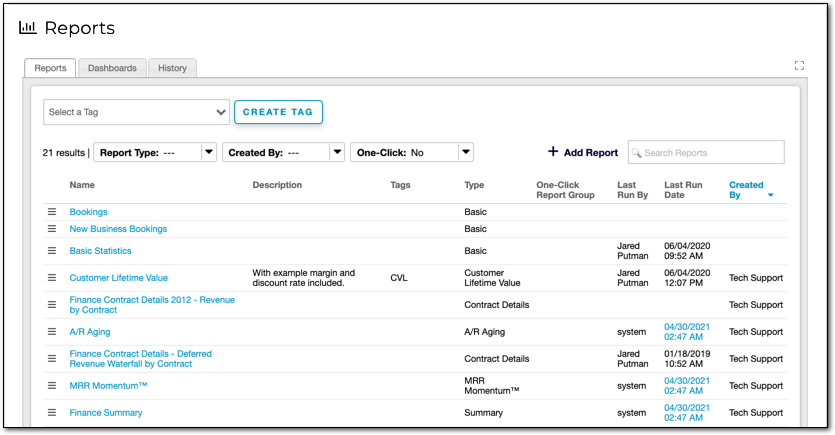
Only the user who created a report can edit it, unless an Admin enables Permit Any Admin to Edit All Reports in Configure Account Settings.
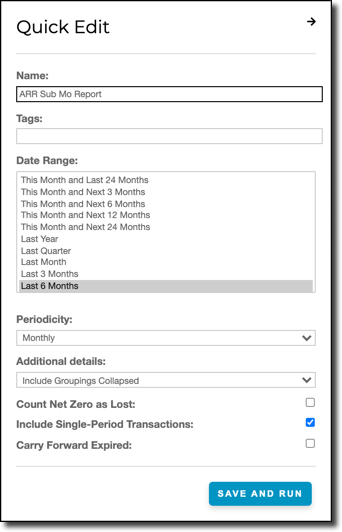
To make changes without opening the full configuration page
- Open the report and view its results.
- Click Quick Edit.
- Update the report's name and tags, and, depending on the report type, its date range and periodicity.
- Click Save and Run to view the updated results.
Report charts
Several Analytics Reports include charts that help you visualize your business metrics, useful for your own reference as well as for internal and external presentations. Add a chart to a report using its Chart or Output Format option, depending on the report type. Each report includes the recommended chart based on best practices.
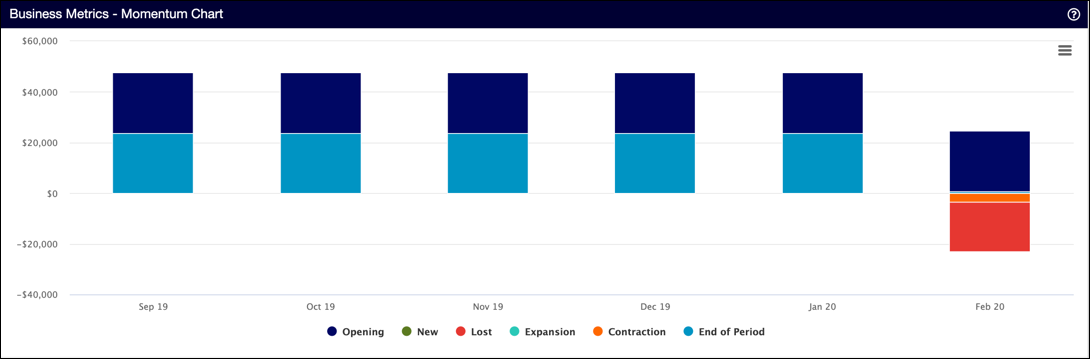
Charts support the following when you're viewing them in a report:
- Hover over a metric to highlight it and view summary information.
- Click a legend entry to show or hide that metric.
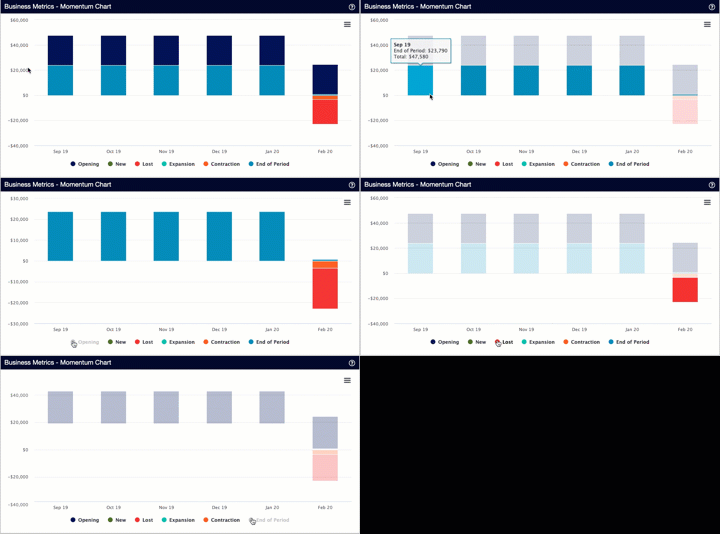
- Download the chart as a PNG or JPG image.
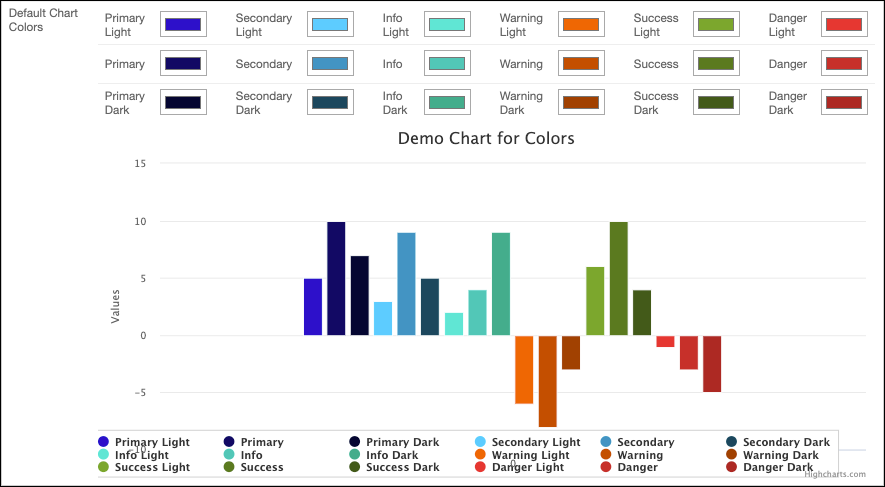
You can customize your charts' colors to match your organization's branding. Maxio organizes chart colors into six categories, Primary, Secondary, Info, Warning, Success, and Danger, each with a light and dark variant. Configure them from Configure Account Settings.
Report history
The Report History page lists every time a report has run in your account. Access it from the sidebar, or from the History tab on the main Reports page. By default, a run's results are automatically deleted 5 days after it completes.
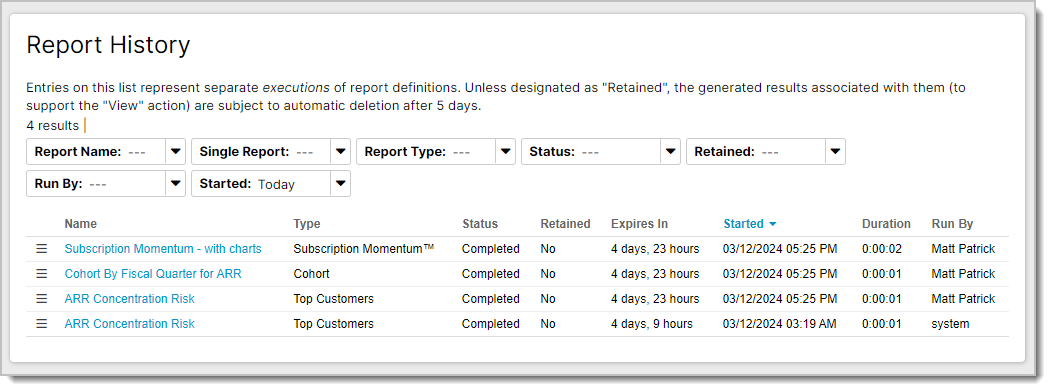
Click a run to view its results from that specific day and time. To keep a run from expiring, use the Retain option. You can also run a report again, export it, or view or change its definition from here.
Before a run's results expire, you can also open them from the main Reports list by clicking its Last Run Date link.
Large reports
When you run a large report, a message lets you know it's processing and that you can continue working elsewhere in Maxio Platform while you wait. Large reports run in detached mode, on resources specifically dedicated to them, so they have less impact on the rest of your account.
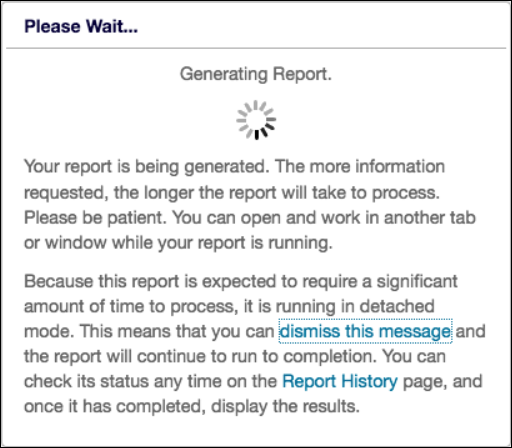
Click dismiss this message to close the notice; the report keeps running in the background either way. Once the report is ready, open it from the Report History page, where you can also check its progress while it completes.
Bulk delete
WARNING: Bulk deletes cannot be undone.
Reports on the Reports list that aren't tied to a Dashboard or a One-Click Report can be bulk deleted.
To bulk delete reports
- Go to Reports > Reports List and set the One-Click filter to No.
- Check the box next to each report you want to delete, or check the top-most box in the first column to select all.
- Click Bulk Delete.
- Confirm the bulk delete.
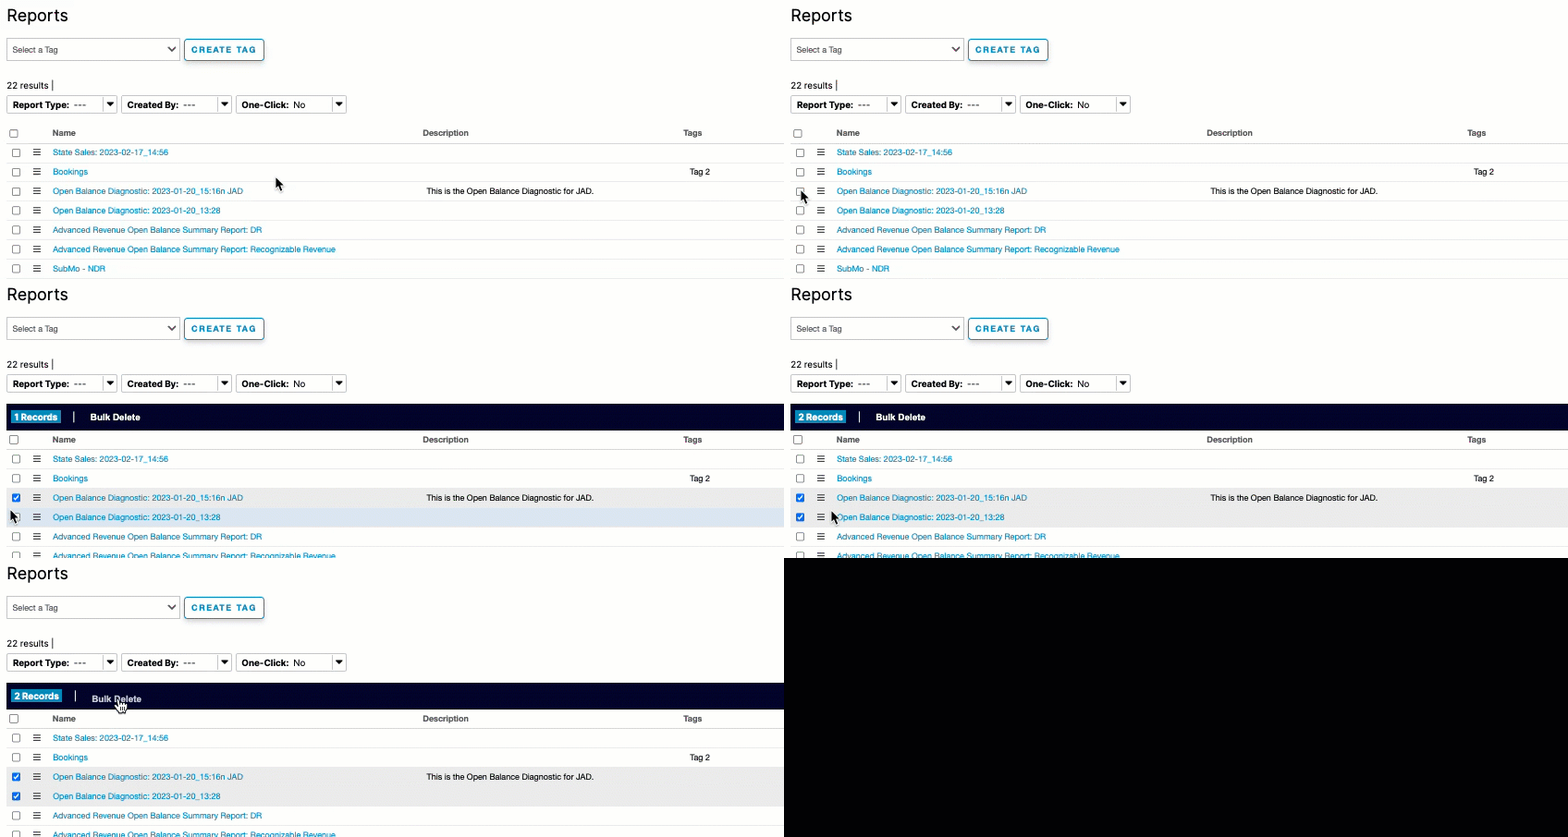
If any selected report is tied to a Dashboard or is a One-Click Report, an error message appears and the bulk delete is canceled.
Tags
Tags provide flexibility in how you organize your reports. Create as many tags as you need, apply them to reports, and filter your reports by tag to group them however works best for your organization.
You can also add tags directly on a report's own Tags field when creating or editing it: enter a comma-separated list, and wrap a tag in quotes if it contains a comma or space.
To create a tag from the Reports list
- Click Create Tag.
- Give the tag a name and select the reports it applies to.
- Click OK.
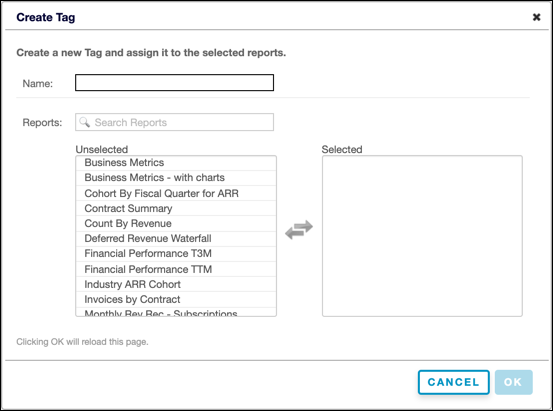
Filter the reports list by selecting a tag from the Select a Tag drop-down. You can also edit or delete a tag from here.
Related information
To send reports out on a recurring schedule instead of running them manually, see Schedule Recurring Reports.
Still need help?
Reach out and our support team will take it from here.