
Track A/R Aging Health Over Time
Last updated on Aug 26, 2026
Use the A/R Aging Health Trend Report to measure the health of your A/R Aging over time, beyond what a single point-in-time A/R Aging Report shows.
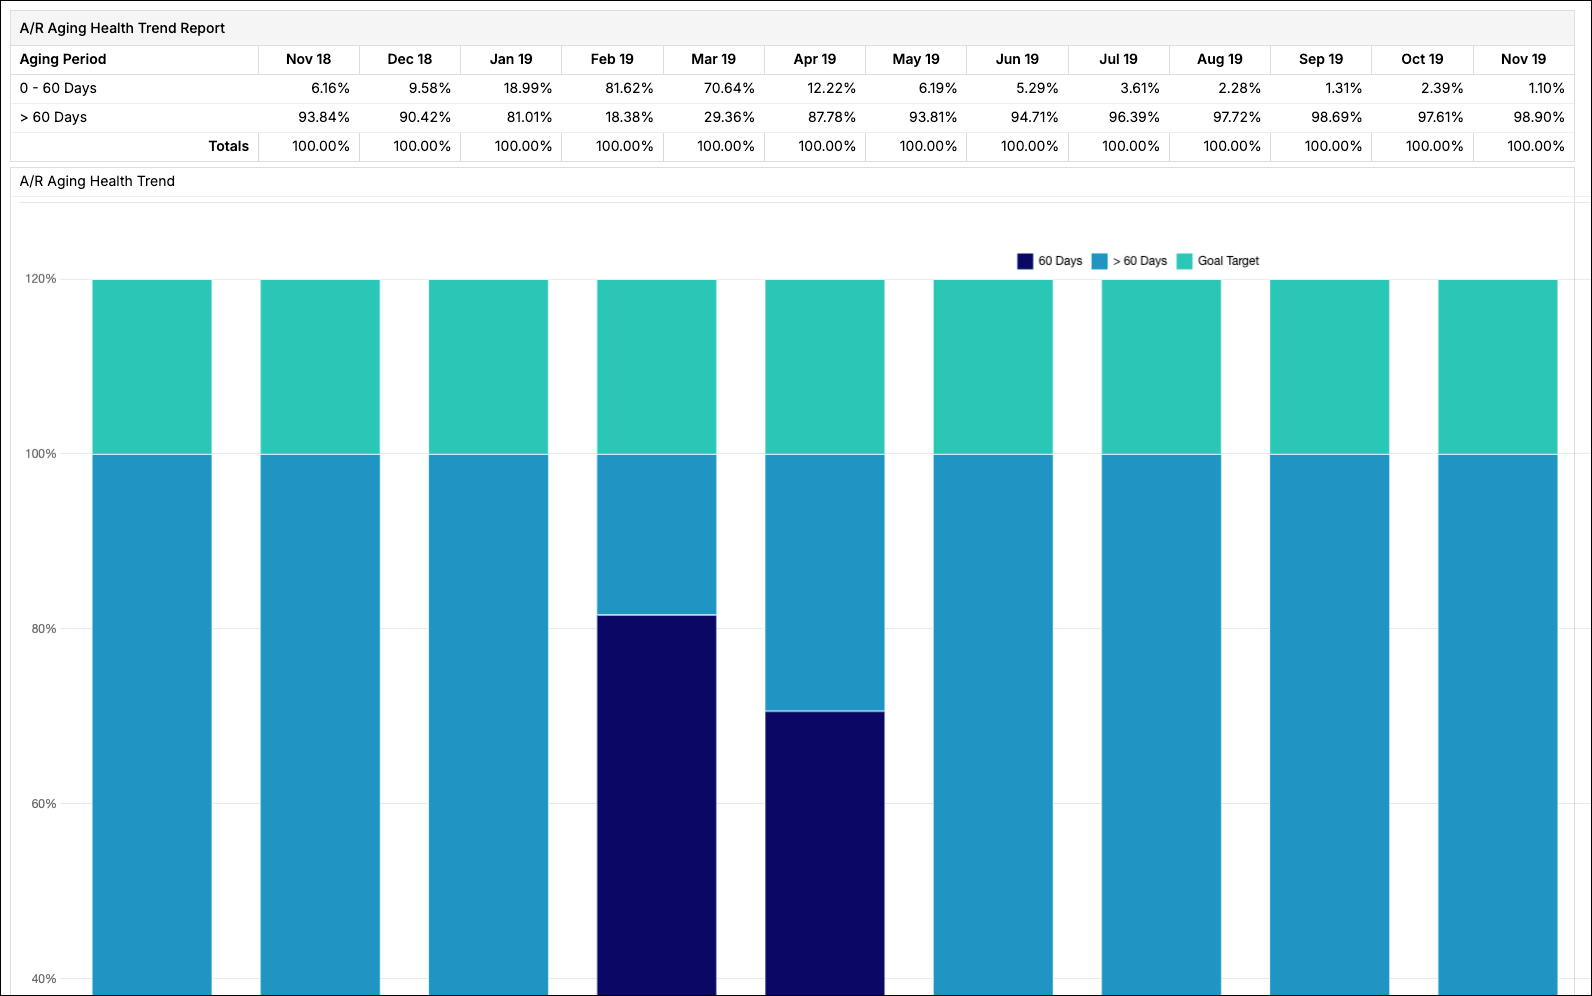
The A/R Aging Health Trend Report is part of Maxio Platform's Advanced A/R Management functionality. For more detail, see Understand How A/R Management Works. To add this report to your account, contact Maxio Support to discuss enabling this add-on module.
Using the A/R Aging Health Trend Report
With this report, you can:
- Measure the percentage of Invoices that have been outstanding past your defined threshold, and compare that to past balances with the click of a button.
- Quickly understand if your current Invoice population is abnormally at risk compared to historical periods.
- Measure whether your Invoice population is getting healthier over time.
Configure options
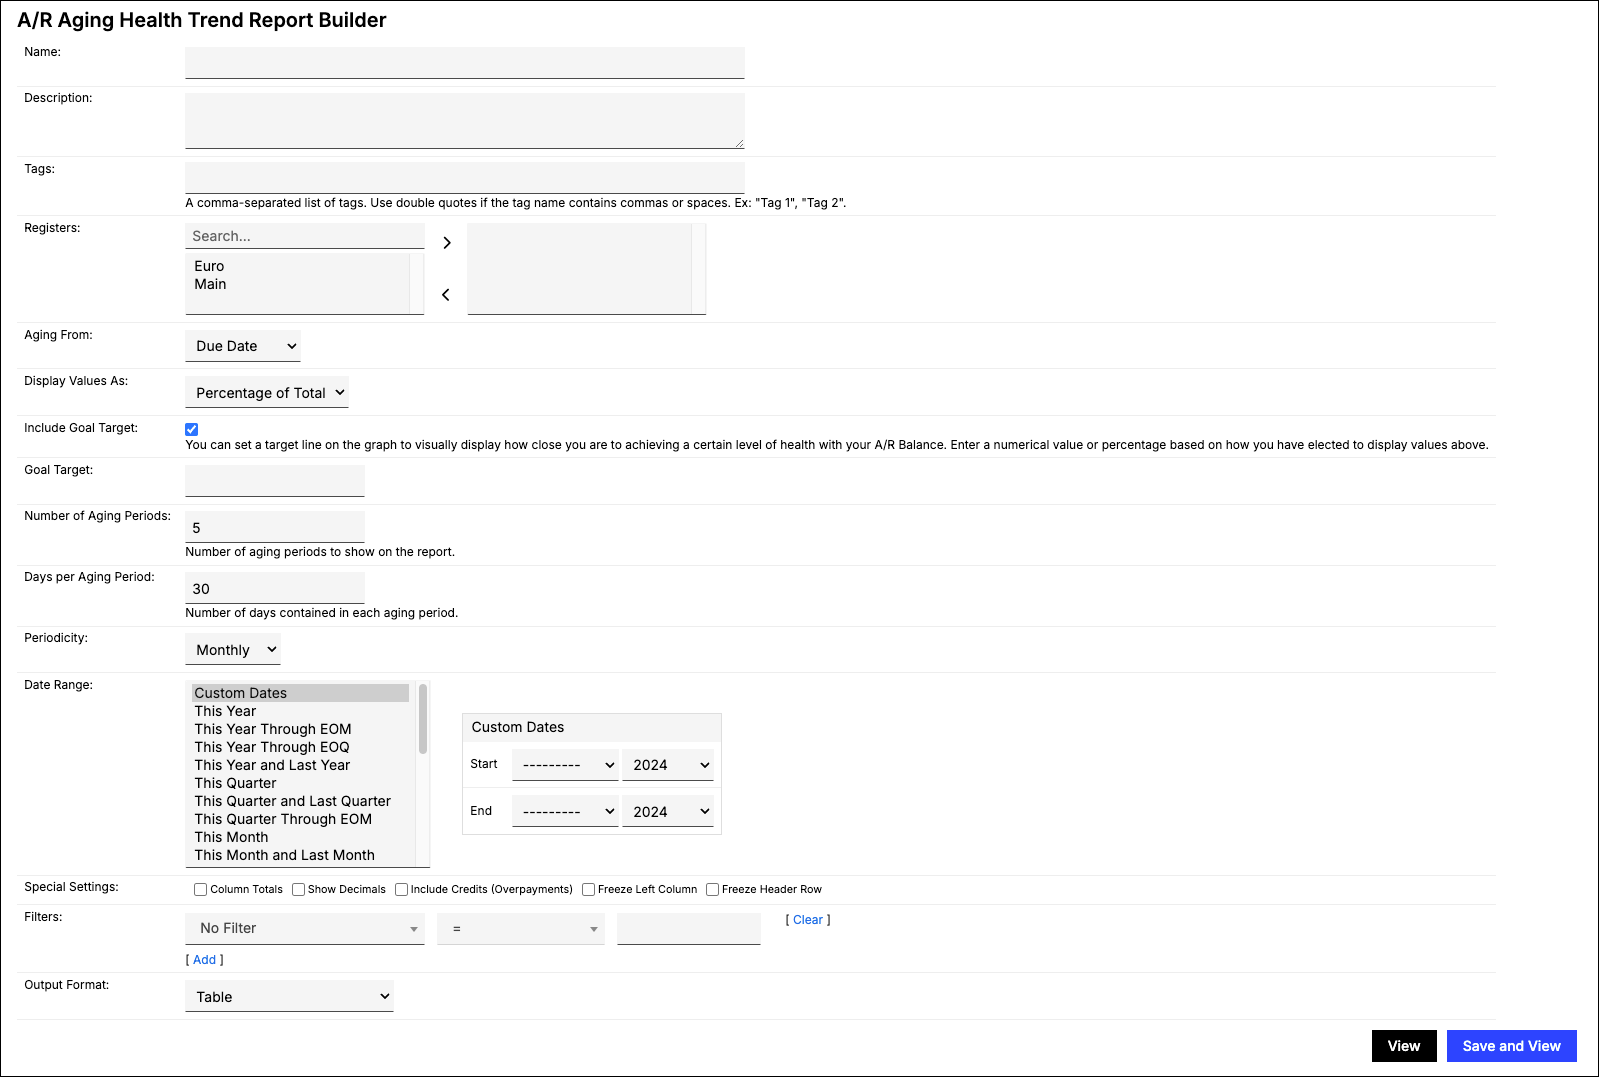
Go to Reports > Add Report > Finance Reports > A/R Aging Health Trend to open the report builder. This report includes the following configuration options.
| Option | Description |
|---|---|
| Registers | Select one or more Registers from which Transactions are to be included. If none are selected, all are included. |
| Aging From | Choose which date the report ages from:
|
| Display Values As | Choose Percentage of Total (default) or Sum of Values. |
| Include Goal Target | Enabled by default. Adds a target line to the graph representing your A/R health goal. |
| Goal Target | The target value for your A/R health goal, entered in whichever unit Display Values As is set to (a percentage number if Percentage of Total, a currency sum if Sum of Values). This value isn't automatically converted between the two. |
| Number of Aging Periods | Determine the number of periods you want to use to divide your dataset. |
| Days per Aging Period | Determine the length of each aging period. |
| Periodicity | This is a separate setting from Number of Aging Periods and Days per Aging Period above: those control the aging buckets themselves (the report's rows), while Periodicity controls how often the report takes a new trend snapshot across your Date Range (the report's columns). Choose Monthly, Quarterly, or Yearly. Quarters and years follow the calendar, so their length varies (90-92 days for a quarter, 365-366 for a year). |
| Date Range | Select fixed Custom Dates or one of the date range options. |
| Filters | Select one or more filters and appropriate matching criteria to filter in or out relevant Contracts or Customers. Invoice-level fields (Invoice Number, Type, PO Number, Memo) aren't available for this report's filters. |
| Output Format | Choose Table or one of the supported charts: Line Chart, Vertical Bar Chart, Stacked Vertical Bar Chart, or Stacked Area Chart. |
Still need help?
Reach out and our support team will take it from here.